
| ||||||
 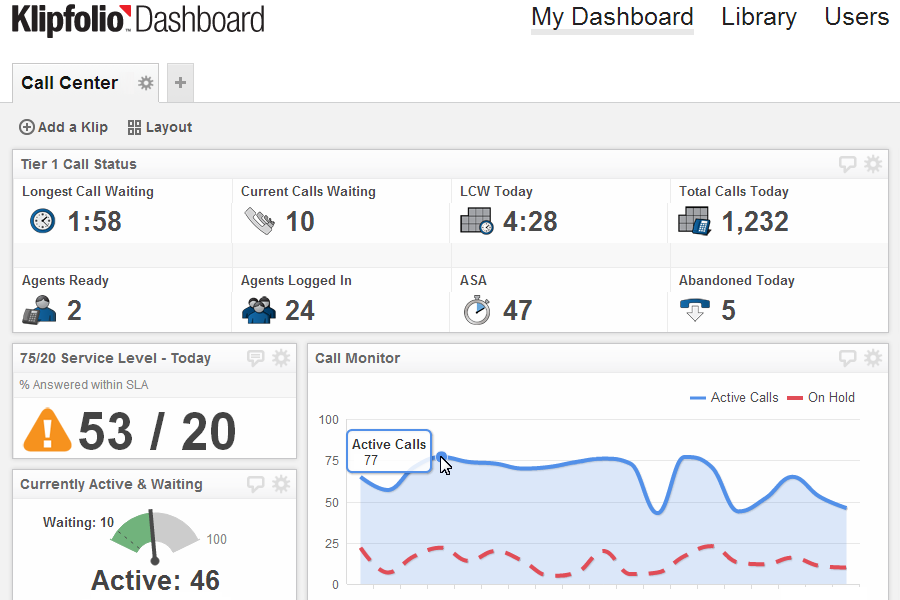 |  |  | ||
Real time performance reviewThe operational performance of your call center is dependent on a combination of factors. New challenges can arise on a minute-by-minute basis. A call center KPI Dashboard helps you see those challenges by providing a real time view of the metrics and numbers that are affecting your performance. | Call center activity evaluationSuccessfully managing your call center's performance depends on having the right data at your immediate disposal so you can meet your service level agreements. Your indicators are instantly available on your KPI Dashboard to alert you to necessary course corrections. | Data you need when you need itA real-time call center KPI Dashboard gives you the data you need when you need it the most - right now. No more managing by intuition. Now you can manage by factual information. |
| ||||||
 |  |  | ||
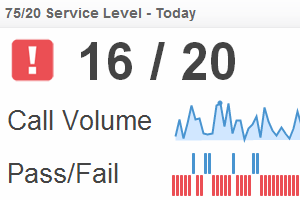
Service levelThis call center KPI Dashboard is the single most important tool to monitor delivery of world-class service to your customers. Your call center's Service Level Agreement is your commitment to a standard of service. If you are unable to measure your SLA metrics in real time, you could be in trouble.
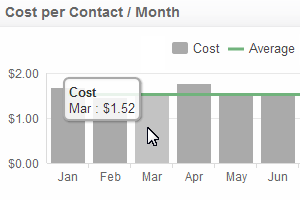
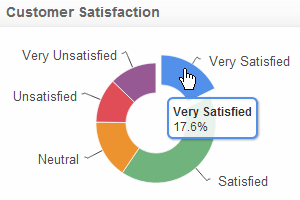
| Cost per contactEach time one of your agents takes a call or sends an email it costs you money in wages and operating costs. The Cost per Contact KPI Dashboard template can help you keep your costs on target . Audience: Executives, Managers Calculation: # of calls per month / (operating cost + labour) | Customer satisfactionOne of the hardest things to measure is customer satisfaction. It is often too subjective to accurately measure and it takes too long to gather the information in order to use it effectively. This template can keep real time customer satisfaction details visible to your entire team.
|
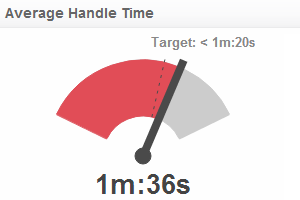 |  |  | ||
Average handle timeThis call center KPI Dashboard template measures the average time spent on each call, including the ancillary activities before and after the call. You can use this KPI to measure aggregate or individual performance.
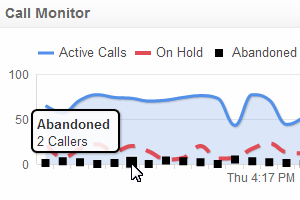
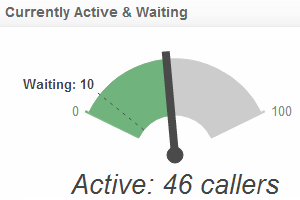
| Call abandonmentThis template indicates the number of callers who terminate their incoming call before they can be connected to an agent. Monitoring this indicator helps to identify responsiveness. It may also indicate whether or not your center is adequately staffed. Audience: Managers, Executives Calculation: Abandoned Calls / Total Incoming Calls | Active and waiting callsThis KPI Dashboard template measures call volume in real-time. This is another effective tool to help ensure that you are fully staffed to deliver optimal performance.
|
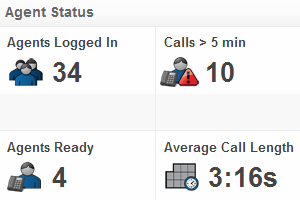 | 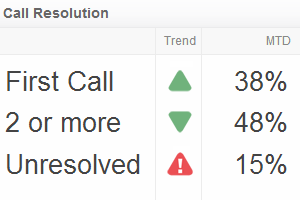 | 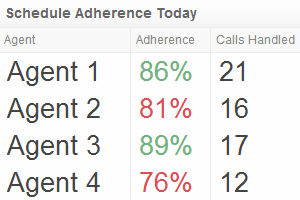 | ||
Agent statusThis KPI Dashboard template delivers four significant KPI, giving a manager an excellent overview of real time performance. The combination of these four elements is liking have a GPS for your call center. You will know where you expect to go, how to get there, the progress you are making, and the adjustments you need to make. Audience: Agents, Managers, Executives | Call resolutionThis template will give you some insight into both customer satisfaction and agent effectiveness. This KPI Dashboard graphic can be used at either the agent or call center level. Used at both levels, the data will prompt you to discover where improvement is necessary. Audience: Agents, Managers, Executives Calculation: # of calls resolved after x amount of contacts / total # of calls | AdherenceUncontrolled adherence rates can significantly impact call center costs. This KPI Dashboard template helps you to analyze how well an agent works within their schedule and to determine how efficiently they are spending their time. |
| Dashboard Information | Industry Dashboards | Department Dashboards | About Us | Legal |
| Connect Your Data Visualize Your KPIs Monitor Your KPIs Share With Colleagues Cloud Hosted Data Security Mobile Access Real-Time Data Visibility Operational Intelligence Consolidate Key Metrics | Call Centre Dashboards Retail Dashboards Financial Services Dashboards Insurance dashboards Health Care / Medical Dashboards Manufacturing / Supply Chain Dashboards | Sales Dashboard Marketing Dashboard Executive Dashboard Web / Social Dashboards | Professional Services Klipfolio Partnership Contact us | Privacy Policy Terms and Conditions Data Security |
| Copyright © 2016 Data Geeks. All Rights Reserved. | ||||