
| ||||||
  |  | |
KPIs for retailManaging your supply chain is critical to ensuring that your inventory is at optimum levels and costs are under control. It is vital to know which items are selling and which are not. Business intelligence (BI) software enables supply chain, logistics, and sales information to be gathered and analyzed with greater ease than ever before. Your KPI Dashboard makes accurate, data-driven, real-time information visible to those employees who can manage the business to meet your objectives. You can manage inventory in transit, in the warehouse, and on the shelf. You will be able to effortlessly monitor important retail KPIs relevant to every aspect of your organization. | Consolidate all metrics in a single dashboardA KPI Dashboard is an important tool to make the key retail KPIs available. You can monitor performance from your office PC or while away, using a mobile device. You will be able to easily view and instantly recognize when any aspect of your business is not meeting expectations. Because you are seeing real-time data, you can drive the changes necessary to ensure your performance expectations are met. |
| ||||||
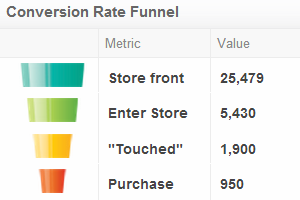 |  |  | ||
Conversion ratesThis KPI Dashboard template will help you to know how successful your organization is at converting shoppers into customers. Having this information will help you to understand which areas need attention before it's too late.
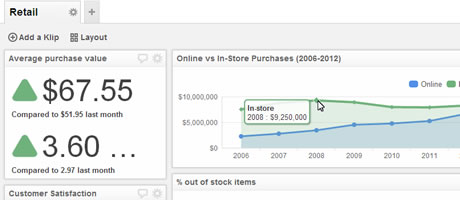
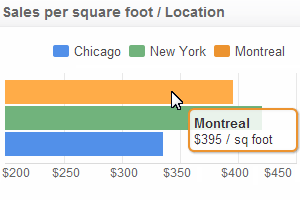
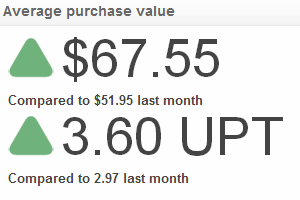
| Sales per square footThis template shows your sales volume per square foot. Customizable for single or multiple locations, awareness and comparison of KPIs may help you to better understand why one location is more successful than others.. Audience: Managers, Sales Associates Calculation: Total Net Sales / Total Floor Area | Average purchase valueThis template indicates the average value of each purchase. This information can provide additional insight into the purchasing habits of your customers or lead you to dig deeper into the details to determine how to increase the APV.
|
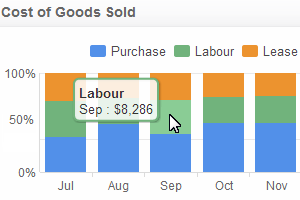 |  |  | ||
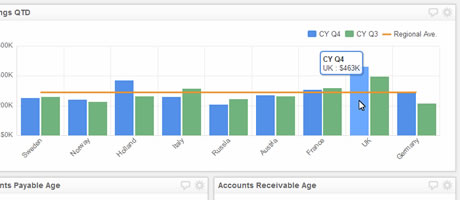
Cost of goods soldWhen what appeared to be a thriving retail business closes its doors, you realize that it didn't cease to exist because of lack of sales. It probably died as a result of the inability to make a profit. Literally hundreds, if not thousands, of once existing businesses would still be operating, if only they had been able to manage their costs. Here is your opportunity to keep that information in front of you.
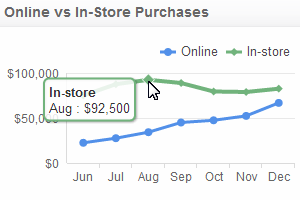
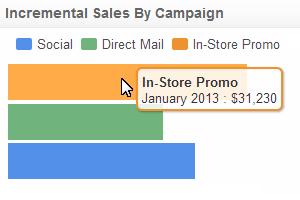
| Online versus in-storeAlmost all retail businesses, regardless of size, now have an online presence. It, therefore, becomes essential to track cyber versus sidewalk activity. Accurately monitoring these business channels against each other can permit you to see important trends and prepare for them Audience: Executives, Managers Calculation: Online purchases compared to in-store purchases | Incremental salesYou've got to understand which promotions work and which ones don't. When combined with additional data captured on your KPI Dashboard, you will be able to plan and execute sales events more successfully.
|
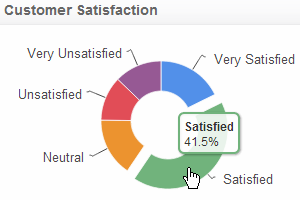 |  |  | ||
Customer satisfactionOne of the hardest things to measure is customer satisfaction. It is often too subjective to adequately measure and it takes too long to gather the information in order to use it effectively. This template can keep real time customer satisfaction details visible to your entire team.
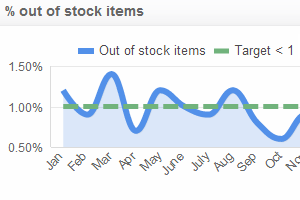
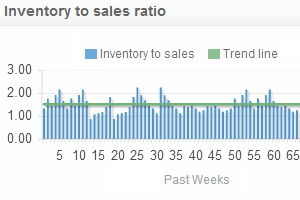
| Out of stock itemsA simple rule of retail is to never be out of stock when you have a buying customer. Inventory management is decidedly one of the most difficult issues to control in any business. This KPI Dashboard template will help you to identify and correct loss of sales because of lack of inventory. Audience: Front-line, Managers Calculation: # of items out of stock / # of items in stock = % of out of stock items | Inventory to sales ratioCarrying too much inventory can be just as crippling as having too little. Setting, and performing to, optimal metrics will make profitability much easier than unnecessarily tying up your money in too much inventory or losing sales because of having too little.
|
| Dashboard Information | Industry Dashboards | Department Dashboards | About Us | Legal |
| Connect Your Data Visualize Your KPIs Monitor Your KPIs Share With Colleagues Cloud Hosted Data Security Mobile Access Real-Time Data Visibility Operational Intelligence Consolidate Key Metrics | Call Centre Dashboards Retail Dashboards Financial Services Dashboards Insurance dashboards Health Care / Medical Dashboards Manufacturing / Supply Chain Dashboards | Sales Dashboard Marketing Dashboard Executive Dashboard Web / Social Dashboards | Professional Services Klipfolio Partnership Contact us | Privacy Policy Terms and Conditions Data Security |
| Copyright © 2016 Data Geeks. All Rights Reserved. | ||||