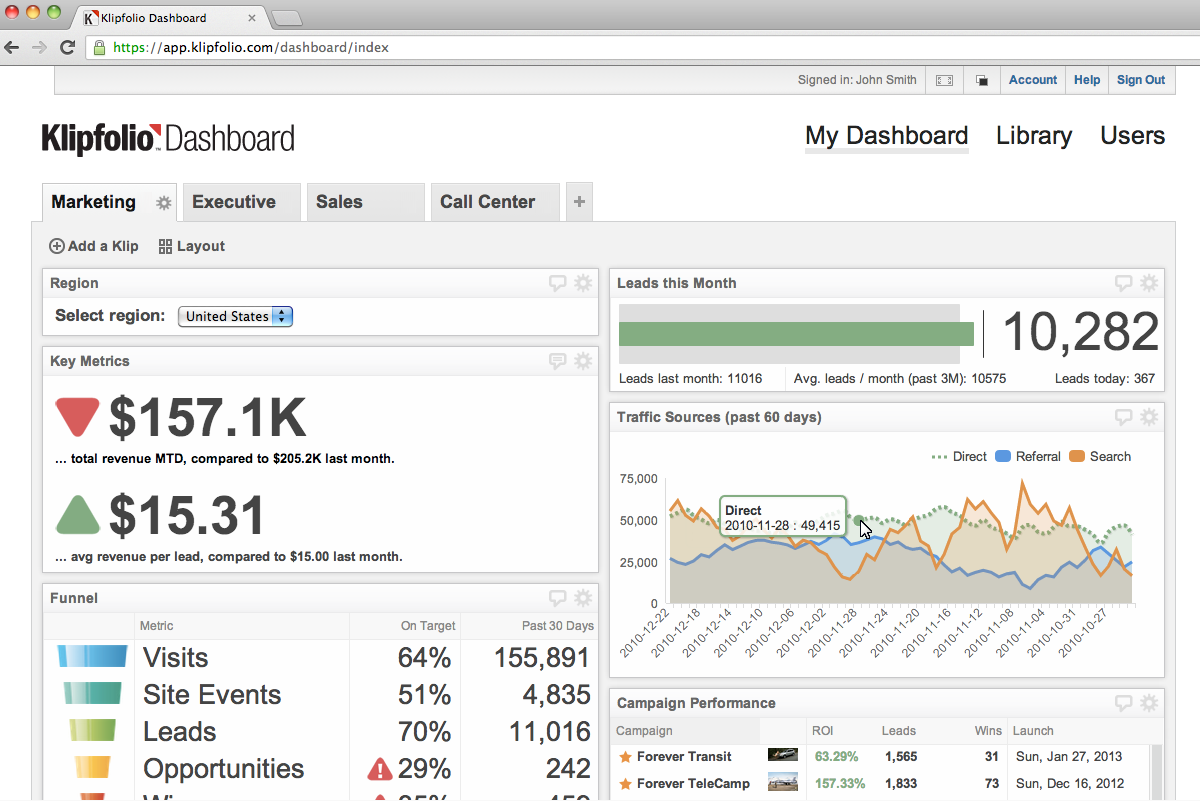
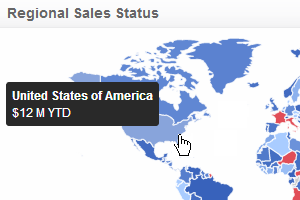
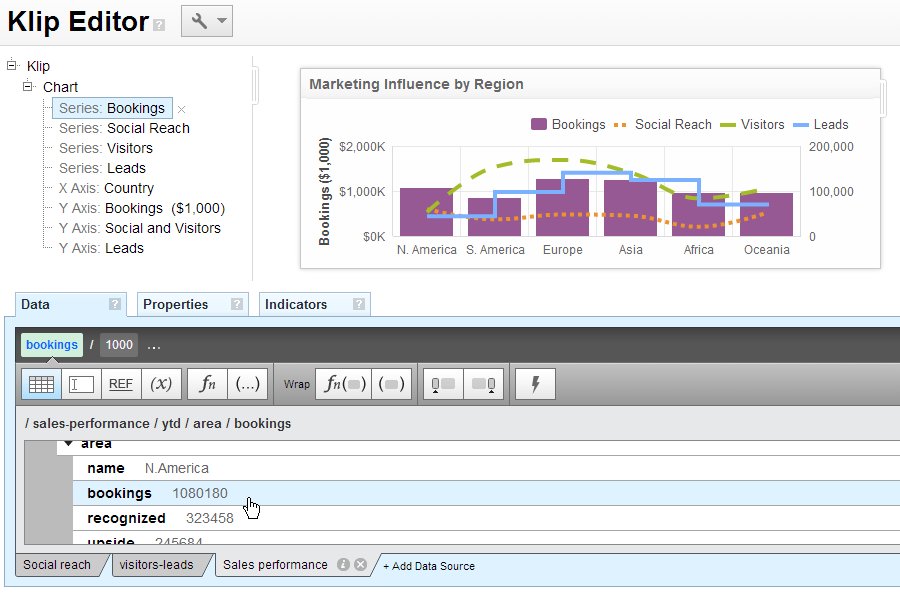
Real Time Performace Dashboards
Menu
  • External link opens in new tab or window
    • External link opens in new tab or window
    • External link opens in new tab or window
    • External link opens in new tab or window
    • External link opens in new tab or window
    • External link opens in new tab or window
    • External link opens in new tab or window
    • External link opens in new tab or window
    • External link opens in new tab or window
    • External link opens in new tab or window
    • External link opens in new tab or window
    • External link opens in new tab or window
  • External link opens in new tab or window
    • External link opens in new tab or window
    • External link opens in new tab or window
    • External link opens in new tab or window
  • External link opens in new tab or window
    • External link opens in new tab or window
    • External link opens in new tab or window
  • External link opens in new tab or window
    • External link opens in new tab or window
    • External link opens in new tab or window


Consolidate Key Metrics. Easily reconcile fragmented data using you KPI Dashboard.


Sometimes too much information is just as bad as not enough. The practice of establishing KPIs and monitoring actual performance against them reduces the amount of data that you need to analyze. Presenting the KPI reports graphically reduces your time analyzing. Presenting your data in a consolidated format, on a KPI Dashboard, in real-time, allows you to respond now, when it makes a difference.

A data-driven KPI Dashboard consolidates all of your data - the truth about what is happening within your company - to your entire organization, customized for everyone to know as much as they need to know. Instead of operating with different information in different departments, your KPI Dashboards keep your entire company on the same page all the time.


Departmental dashboards


Your KPI Dashboard lets you integrate key metrics into unique dashboards for each department in your organization. You can create as many dashboards as you need to cover any number of departments, tasks, projects or processes.


Consolidated graphic reports


Graphic data reporting makes it easier to understand the story behind the data. By consolidating key metrics with the KPI Dashboard, you can use a spectrum of available graphic formats to best tell that story.


Simplified data from multiple sources


Your KPI Dashboard lets you present data from multiple sources in a single widget so that you can create powerful presentations to share your leadership vision with your entire team.


Dashboard InformationIndustry DashboardsDepartment DashboardsAbout UsLegal
Connect Your Data
Visualize Your KPIs
Monitor Your KPIs
Share With Colleagues
Cloud Hosted
Data Security
Mobile Access
Real-Time
Data Visibility
Operational Intelligence
Consolidate Key Metrics
Call Centre Dashboards
Retail Dashboards
Financial Services Dashboards
Insurance dashboards
Health Care / Medical Dashboards
Manufacturing / Supply Chain Dashboards
Sales Dashboard
Marketing Dashboard
Executive Dashboard
Web / Social Dashboards
Professional Services
Klipfolio Partnership
Contact us
Privacy Policy
Terms and Conditions
Data Security  
     
Copyright © 2016 Data Geeks. All Rights Reserved.
 

close lightbox