
| ||||||
 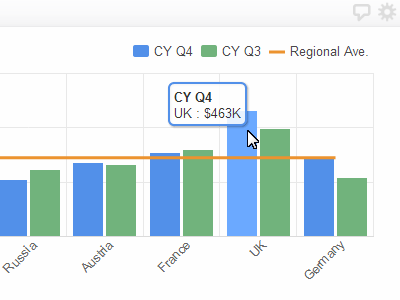 | 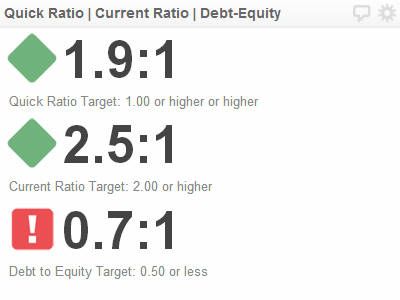 | 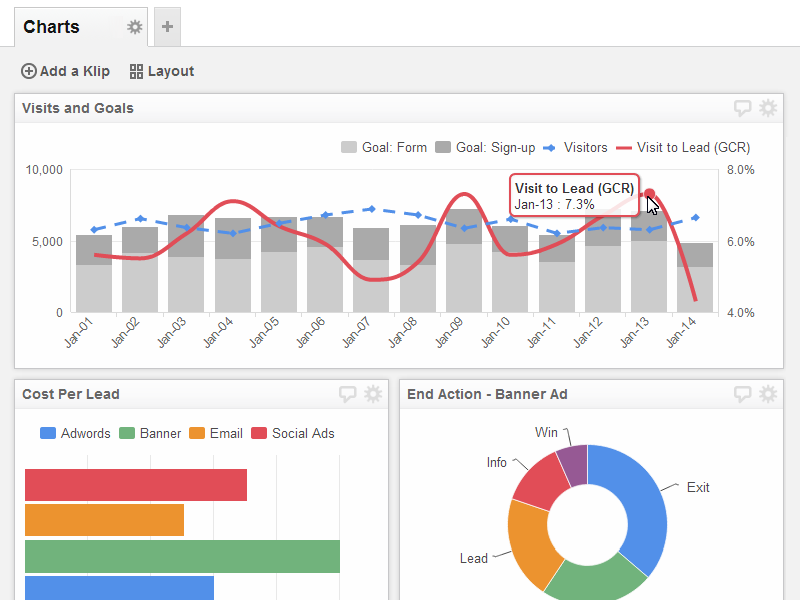 | ||
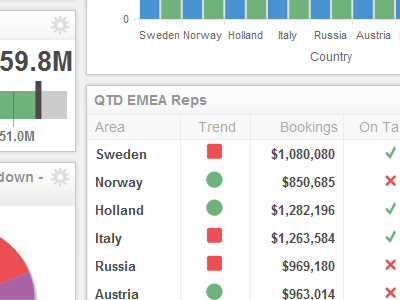
Clear presentationYour KPI Dashboard is simple and easy to understand. You always get the facts without all the irrelevant information that often overwhelms. | Actionable dataYou can use your KPI Dashboard to create high-impact visuals that help you address challenges before they become problems, and realize opportunities much more quickly than in the past. | Chart your performanceIt's simple to monitor the trends affecting your business on your KPI Dashboard. You have complete control to customize your graphics to maximize their impact and effect. |
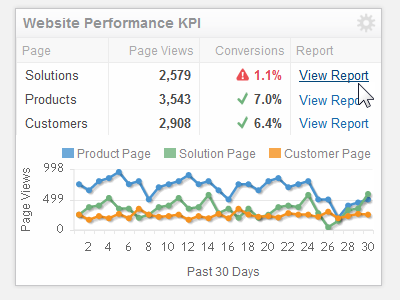 |  | |||
The answers you needYour KPI Dashboard hyperlink support allows you to direct your employees to take the actions necessary to find the answers and solve the problems before they become major issues. | Real-time updatesWhen your real-time data changes, your KPI Dashboard data changes. Your metrics are available for viewing at any time of day or night. Plus, you can set notification thresholds so that you are immediately aware of critical issues. |
| Dashboard Information | Industry Dashboards | Department Dashboards | About Us | Legal |
| Connect Your Data Visualize Your KPIs Monitor Your KPIs Share With Colleagues Cloud Hosted Data Security Mobile Access Real-Time Data Visibility Operational Intelligence Consolidate Key Metrics | Call Centre Dashboards Retail Dashboards Financial Services Dashboards Insurance dashboards Health Care / Medical Dashboards Manufacturing / Supply Chain Dashboards | Sales Dashboard Marketing Dashboard Executive Dashboard Web / Social Dashboards | Professional Services Klipfolio Partnership Contact us | Privacy Policy Terms and Conditions Data Security |
| Copyright © 2016 Data Geeks. All Rights Reserved. | ||||